Oil News & Market Digest
WTI crude oil news and the catalysts behind energy prices.
US-Iran Strikes Drive Oil Higher, Fueling Inflation and Fed Rate-Hike Bets
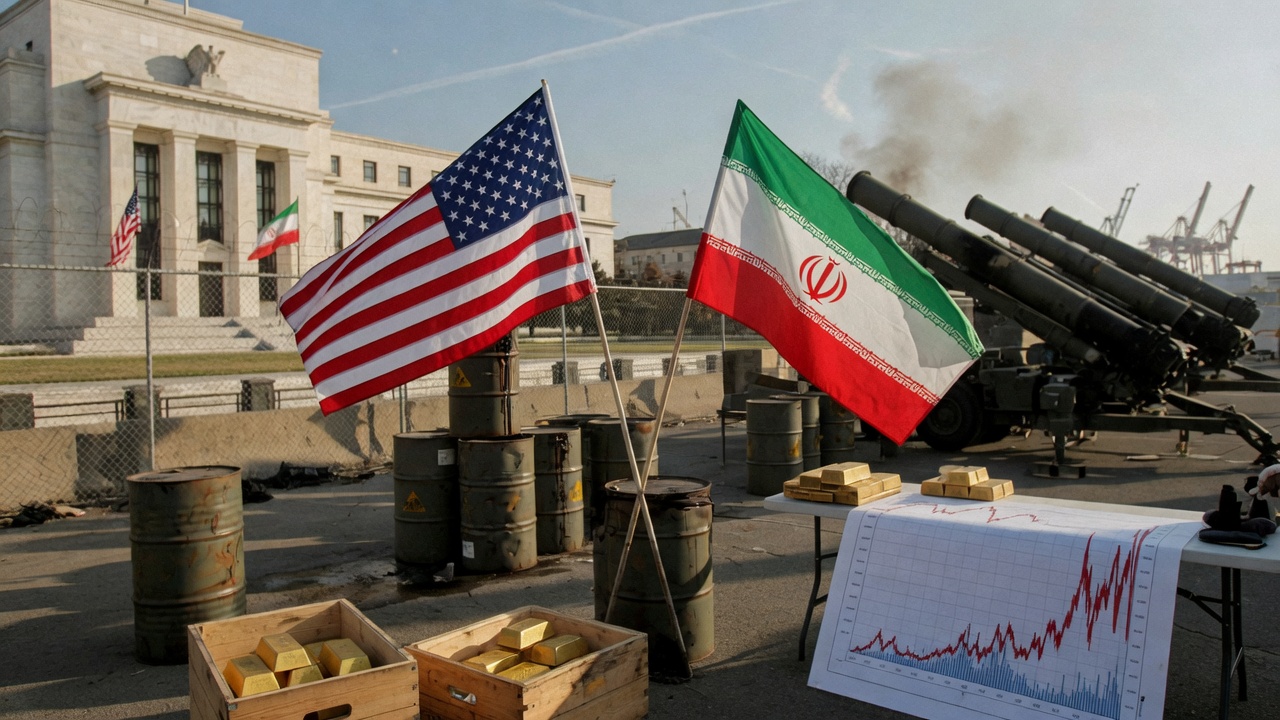
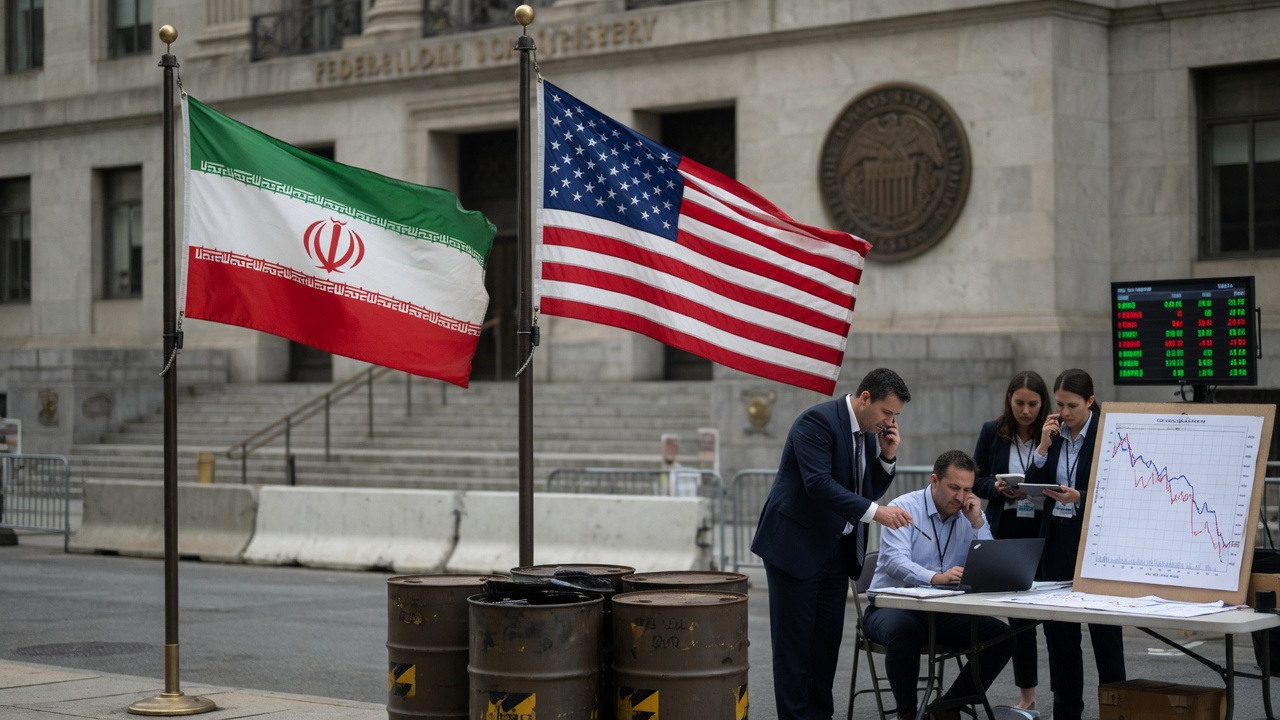
Fresh US strikes on Iran pushed oil prices up, raising concerns that higher energy costs will stoke sticky inflation and prompt Federal Reserve interest-rate hikes. Bond yields rose and gold fell as traders priced in tighter policy.
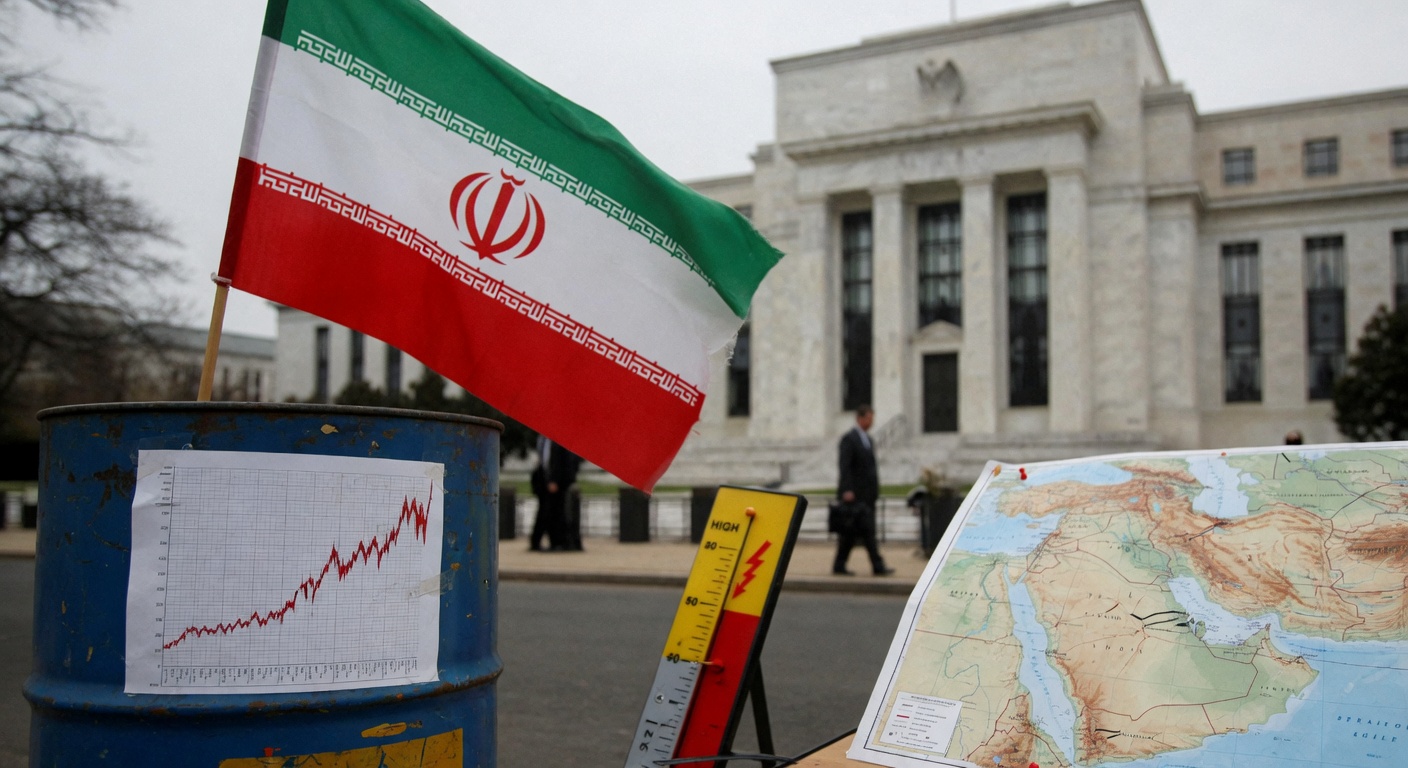
Fed's Favored Inflation Gauge Nears 4% on Iran War Energy Spike
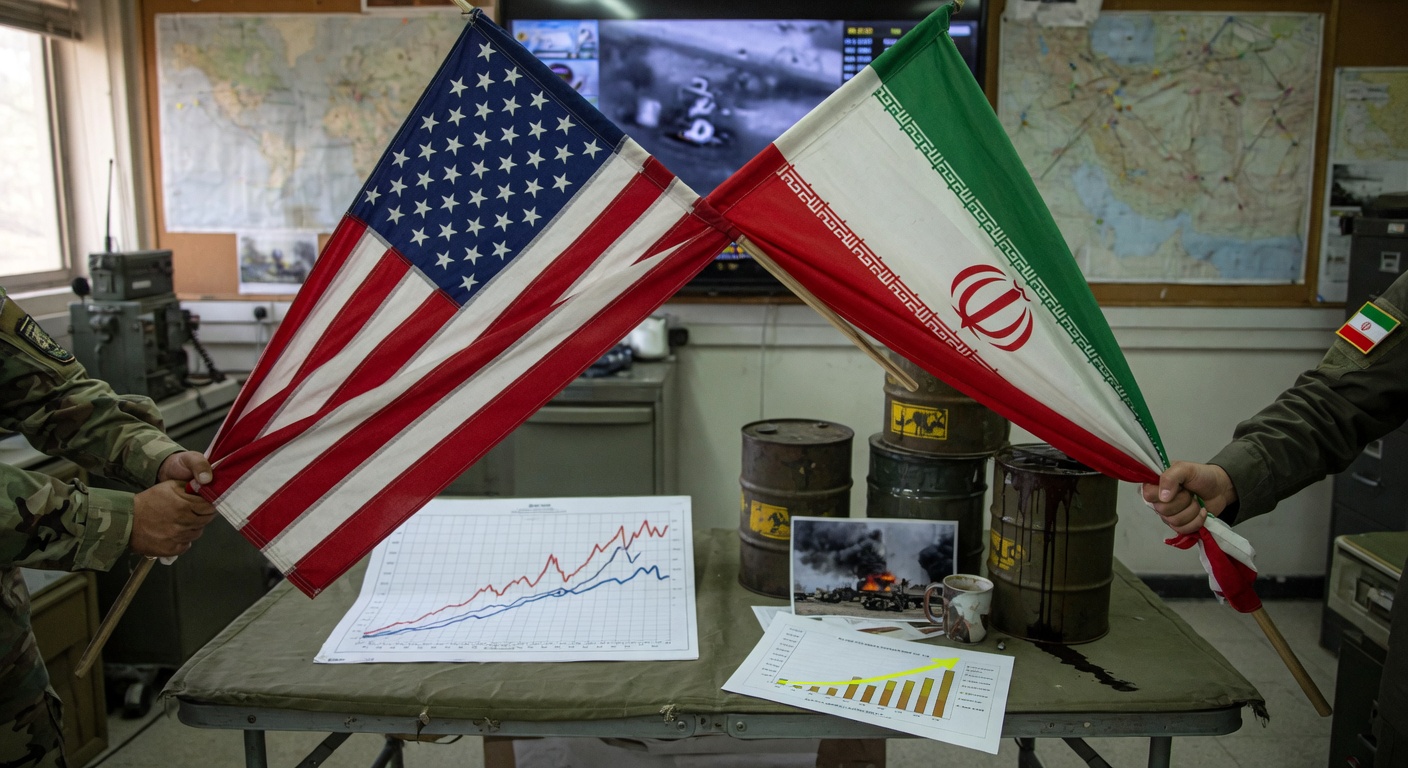
The Federal Reserve’s preferred PCE inflation measure is rapidly approaching 4% year-over-year, with an 8% surge in April driven by energy costs from the Iran conflict, marking the largest two-month acceleration since late 2021.
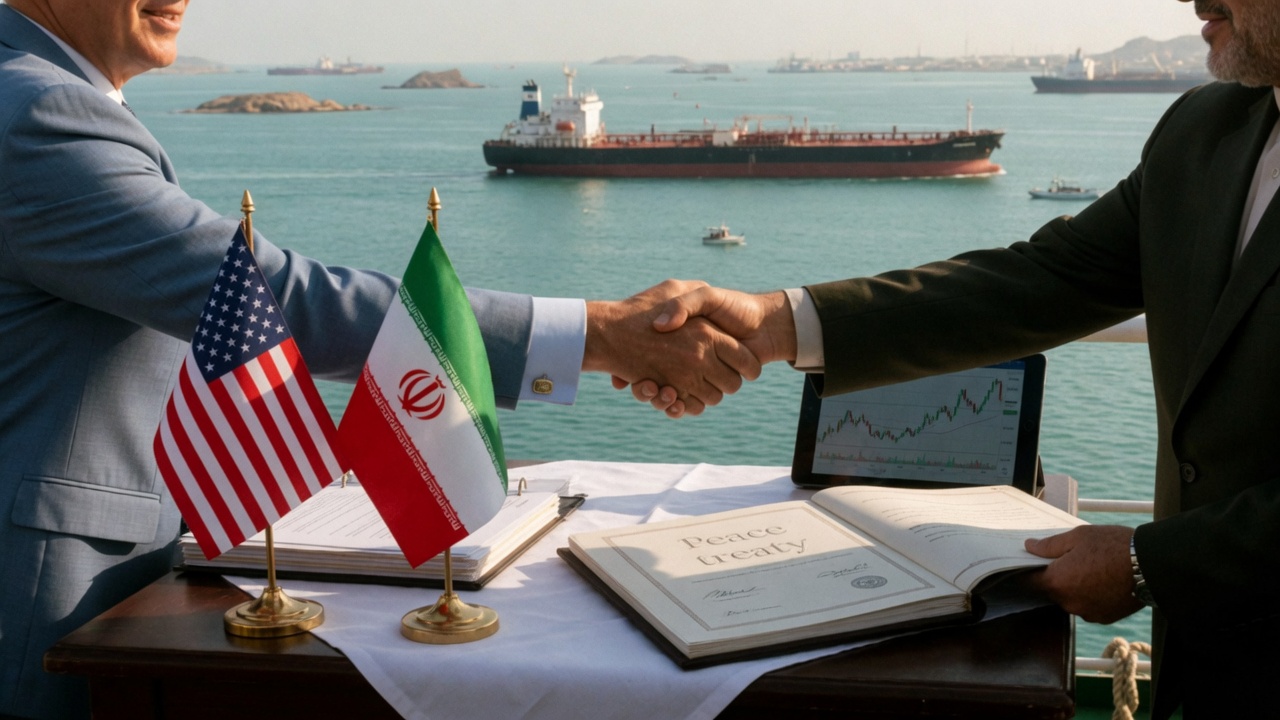
US and Iran Reach Peace Deal, Easing Oil and Inflation Pressures
The US and Iran reached a preliminary agreement to end their war, with signing set for Friday, expected to reopen the Strait of Hormuz and sustainably lower oil prices. Stock futures surged and oil prices fell over 4-5% as a result, reducing upside risks to inflation.
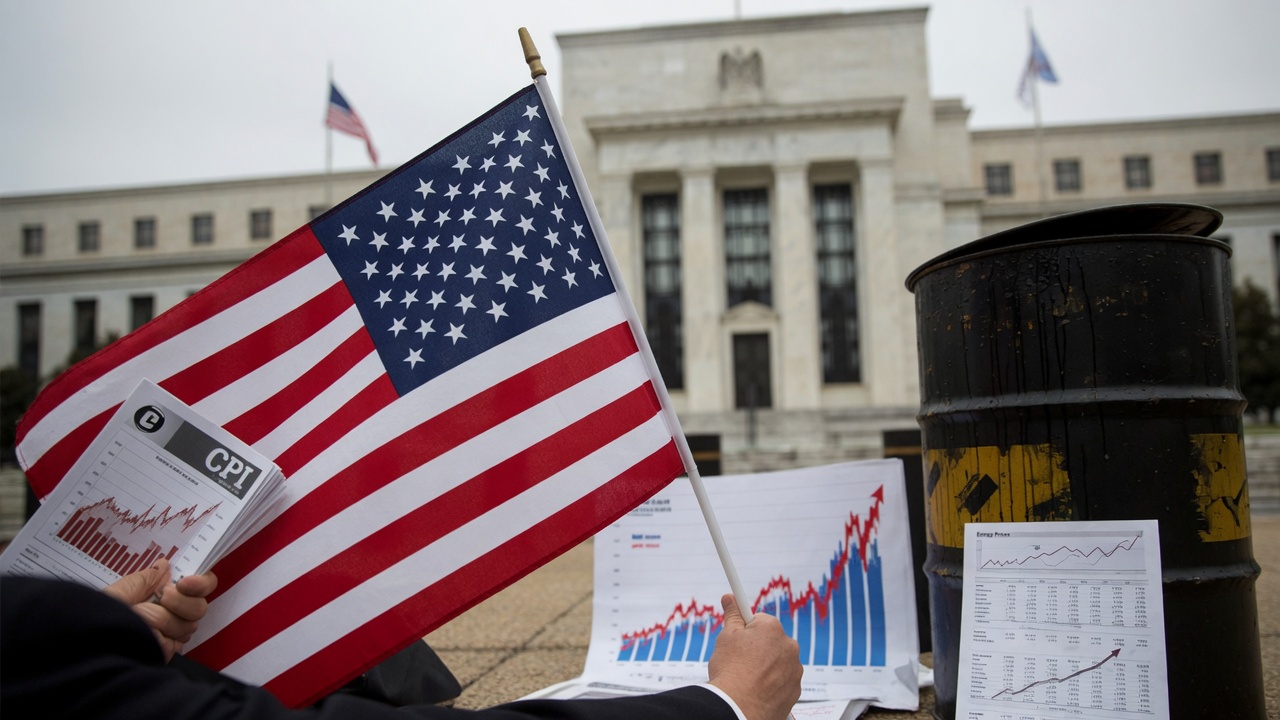
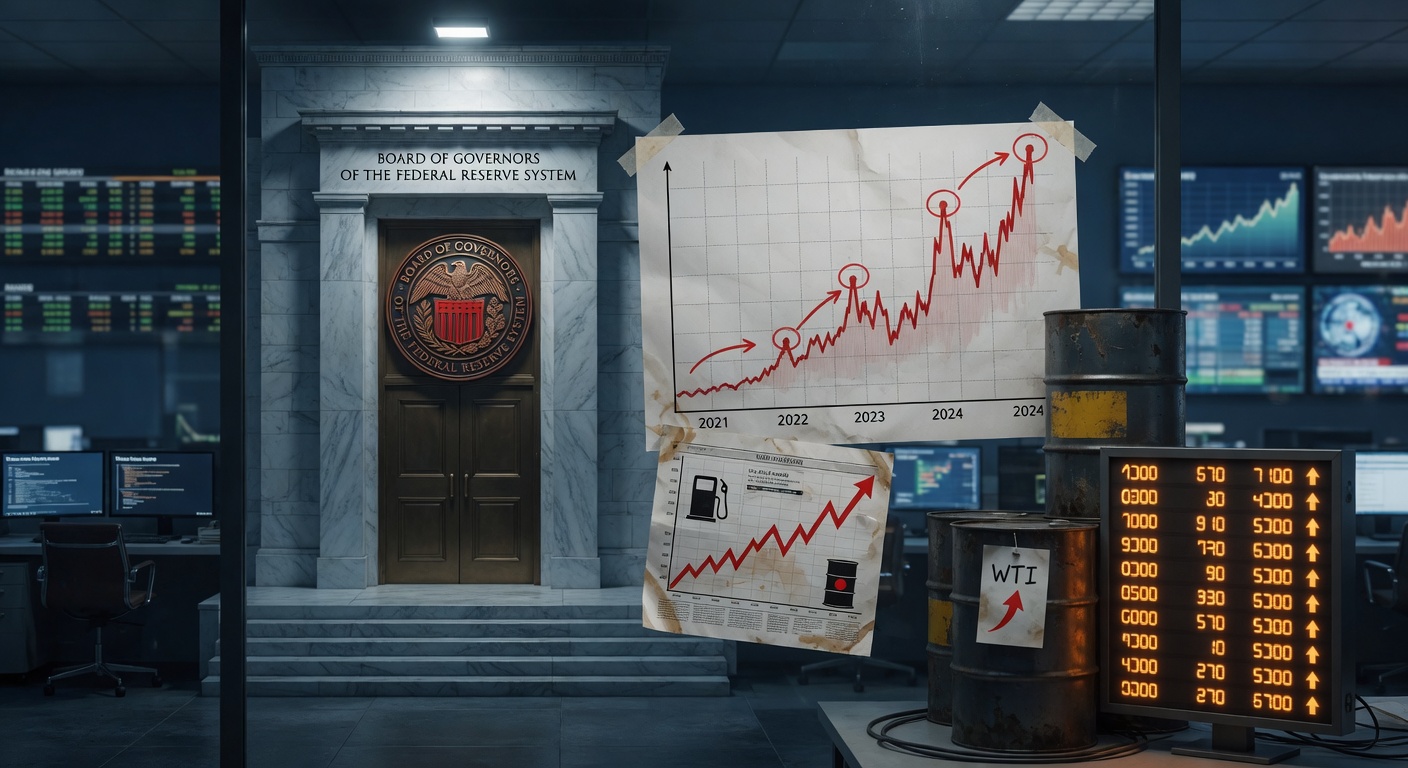
US PCE Inflation Gauge Nears 4% on War-Driven Energy Spike
The Federal Reserve’s favored PCE price index is approaching 4% as energy costs surge due to the Iran conflict, with April data expected to show a 3.8% year-over-year rise—the largest two-month acceleration since late 2021.
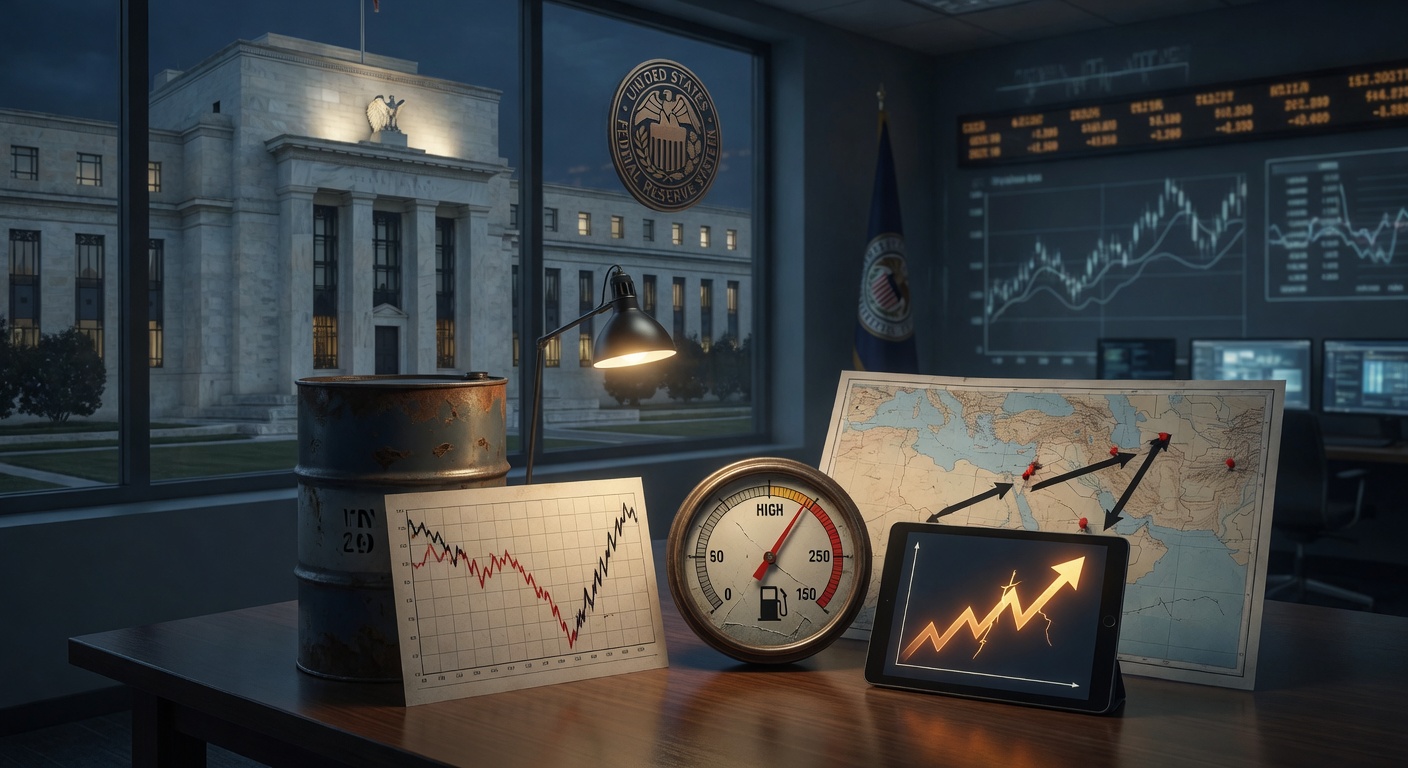
Fed's Preferred PCE Inflation Gauge Approaches 4% on War-Driven Energy Costs
Government data expected Thursday will likely show the PCE price index at 3.8% y/y for April, up a full percentage point from February, marking the largest two-month acceleration since late 2021 amid Iran war-related energy price spikes.
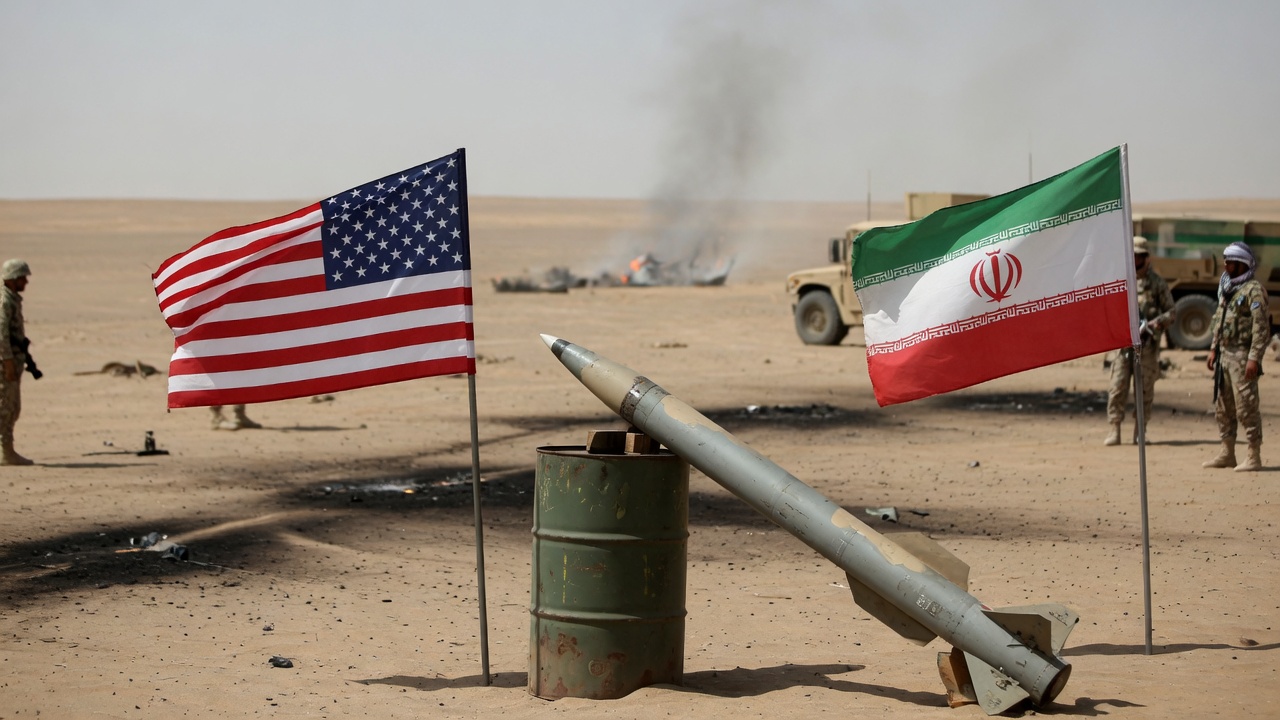
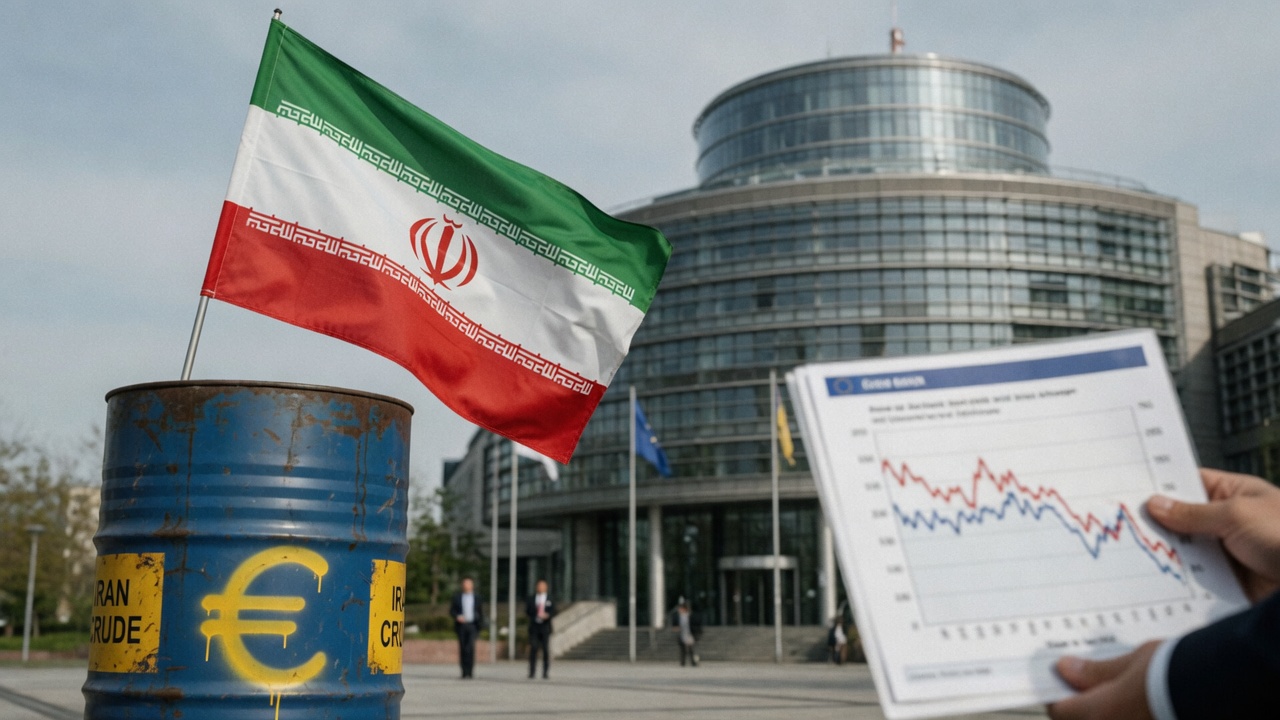
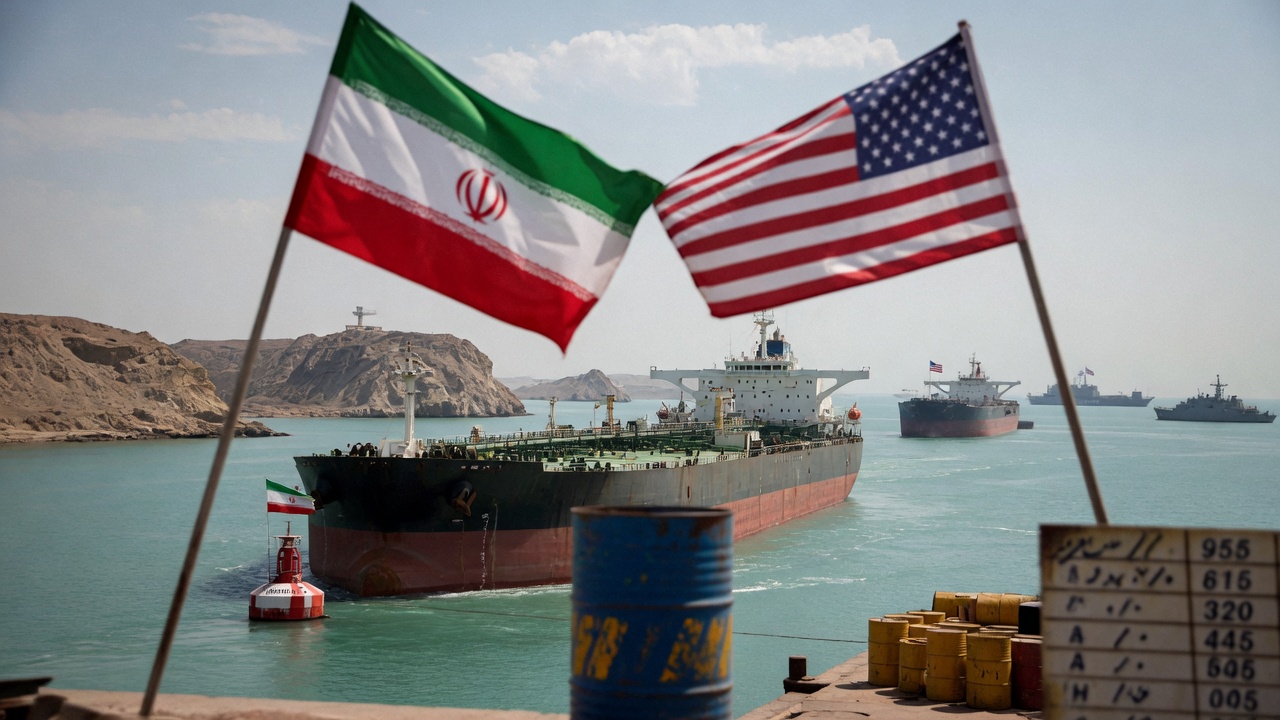
Iran Conflict Surges Energy Prices, Fueling Global Inflation Risks
Iran's effective blockade of the Strait of Hormuz amid US-Iran tensions has driven sharp rises in oil and refined fuel prices, exacerbating inflationary pressures worldwide and clouding the economic outlook.
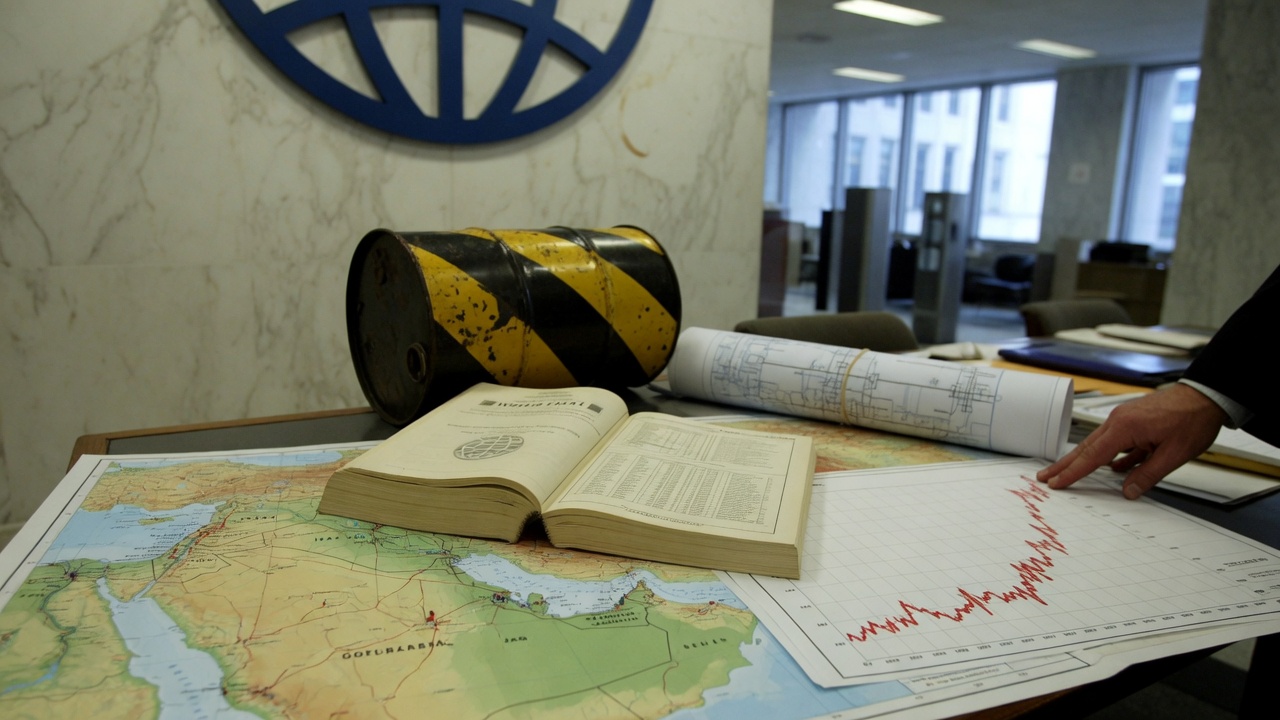
World Bank Warns of Renewed Inflationary Pressures from Middle East Conflict
The June 2026 Global Economic Prospects report highlights sharp energy price increases from the Middle East conflict driving higher inflation expectations and dissipating hopes for near-term monetary easing across major economies.
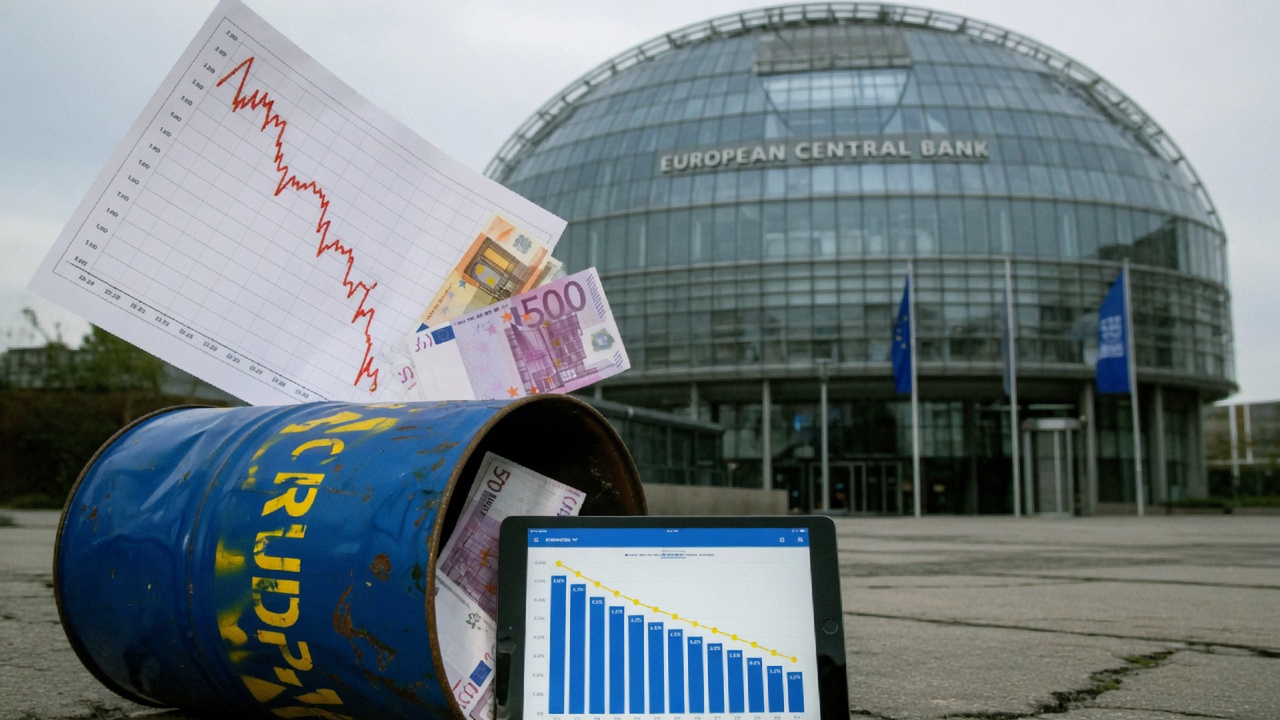
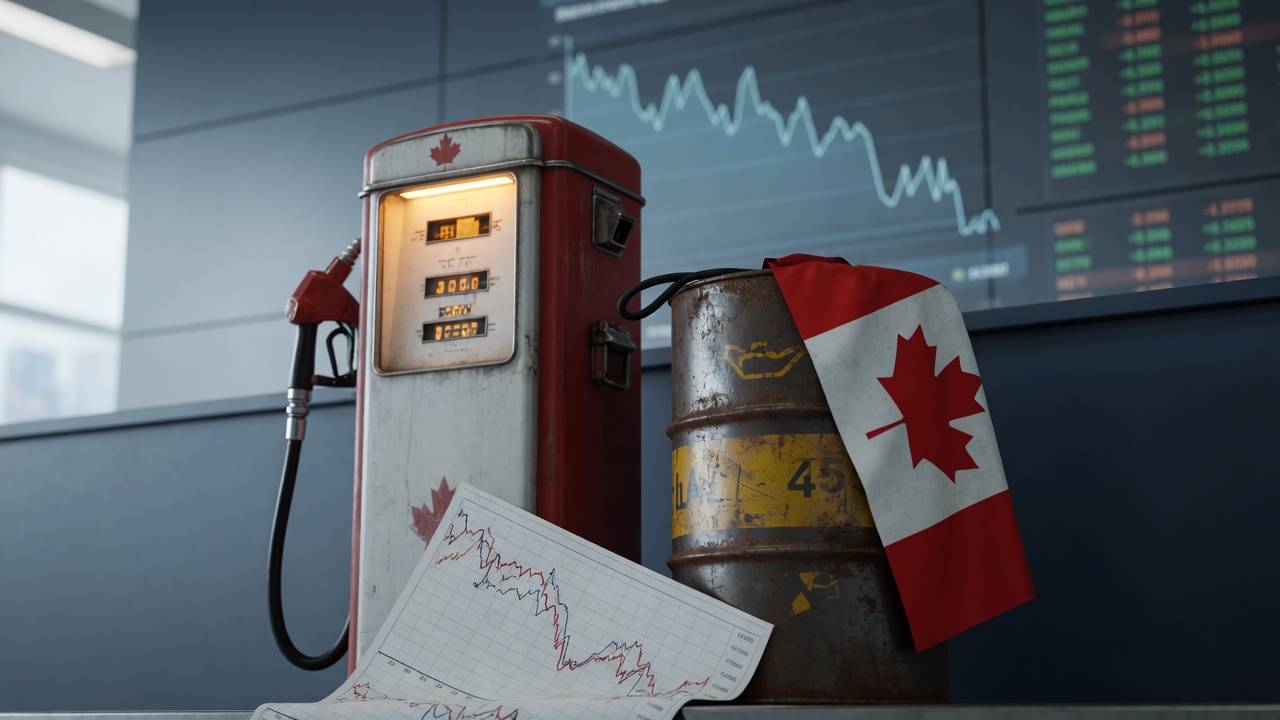

Oil Prices Surge Above $100 on Middle East Tensions, Heightening Inflation Risks
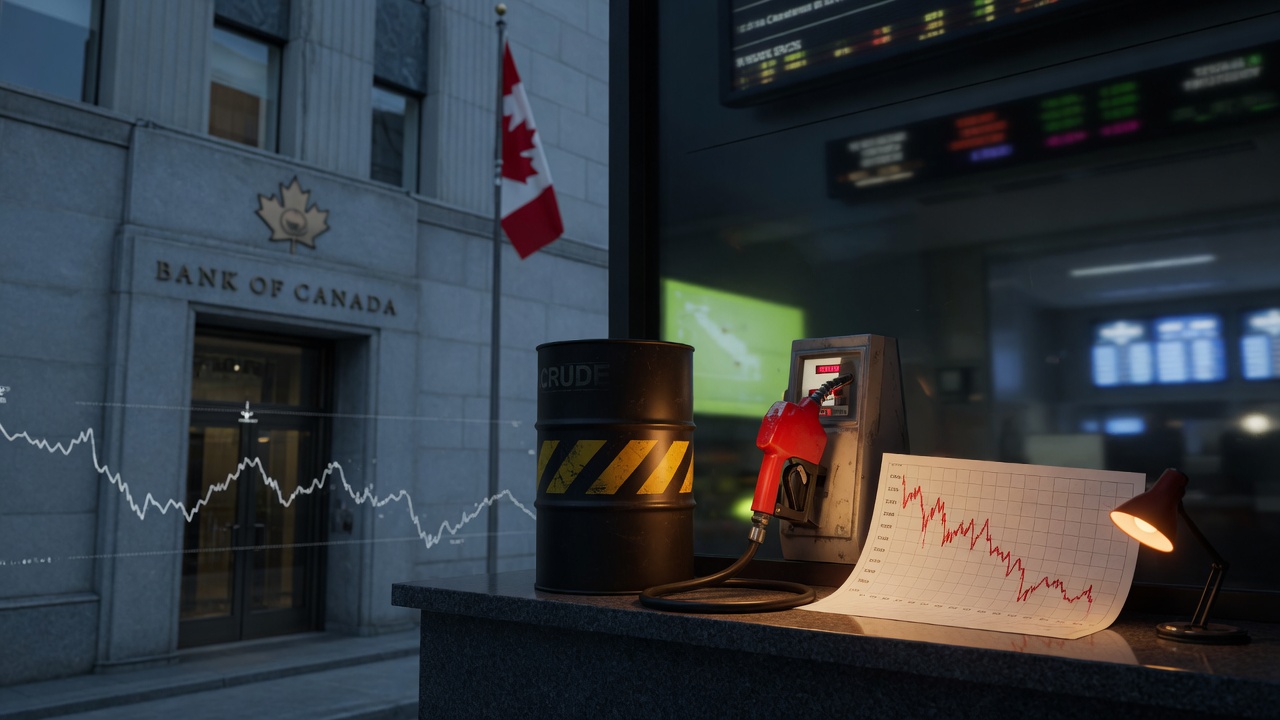
Brent crude jumped above $100 a barrel amid escalating tensions in the Strait of Hormuz, contributing to a Dow drop of over 500 points and amplifying inflation concerns that could prompt further central bank tightening. The energy shock is pressuring both the ECB and Fed outlooks.
Understand the moves behind the headlines
A stop-loss is a pre-set exit that caps the loss on a trade. Learn where to place it, why percentage-based stops fail, and how it links to position size.
The risk/reward ratio compares what you stand to lose against what you stand to gain. Learn how it pairs with win rate to determine profitability.
Each candlestick shows the open, high, low and close for one period. Learn how to read the body, the wicks, and the patterns that actually matter.