S&P 500 News & Market Digest
S&P 500 market news, earnings and macro drivers.
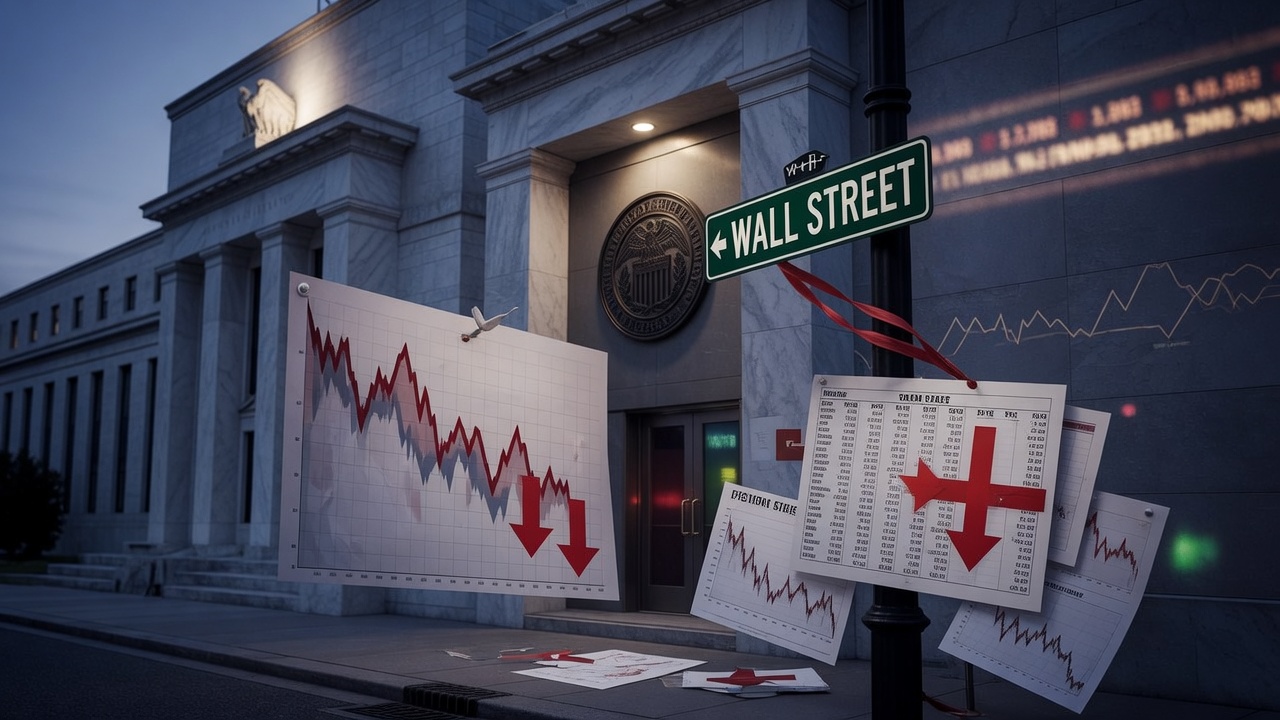
Wall Street Sinks on Fed Hawkish Projections
Stocks fell more than 1% after the Fed meeting, with the S&P 500 and Nasdaq declining as traders priced in a higher likelihood of rate hikes. Bond yields rose sharply following the removal of cutting bias language from the statement.


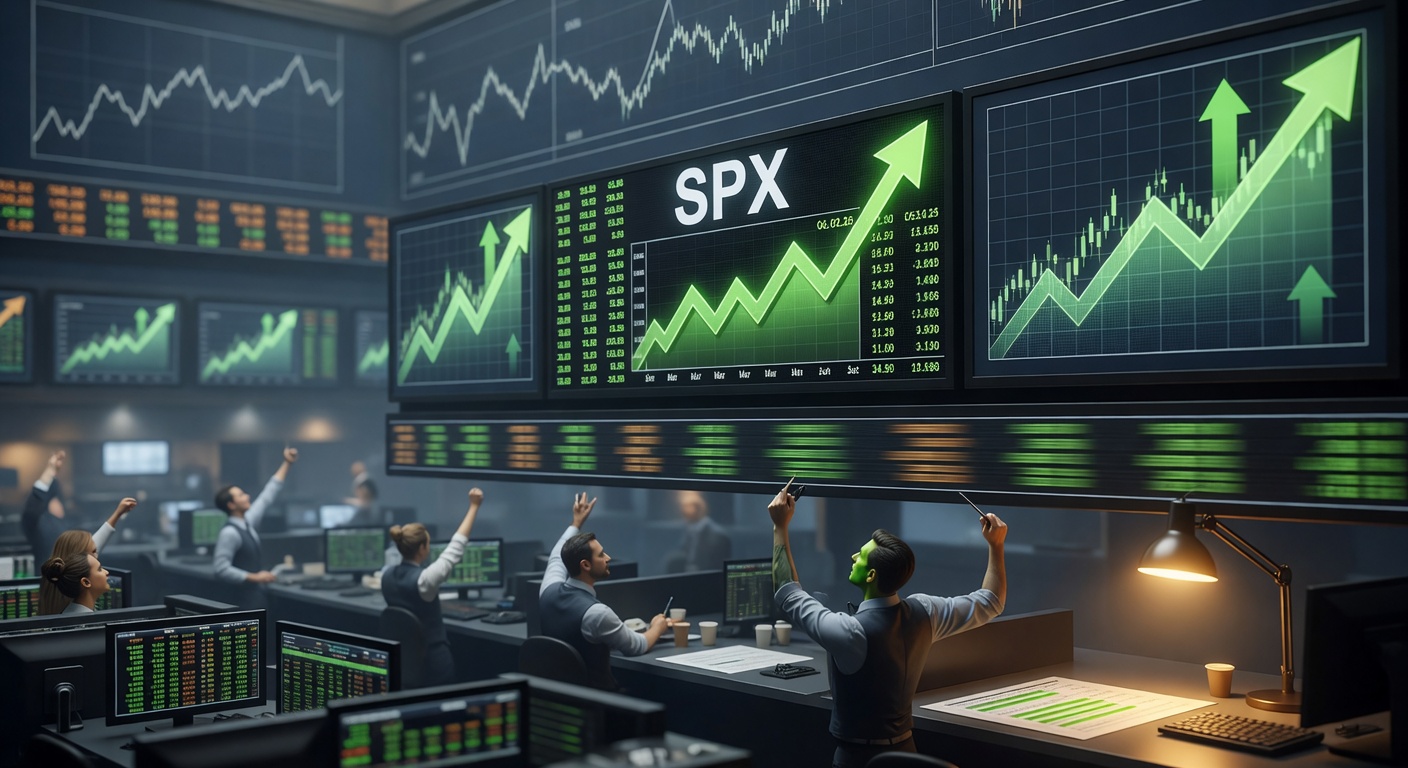
S&P 500, Nasdaq and Dow Close at Record Highs to Start June 2026
On June 1, the S&P 500 rose 0.26% to a record 7,599.96, the Nasdaq Composite gained 0.42% to 27,086.81, and the Dow Jones Industrial Average added 0.09% to 51,078.88, with all three indexes posting new all-time closing highs amid tech-led gains.
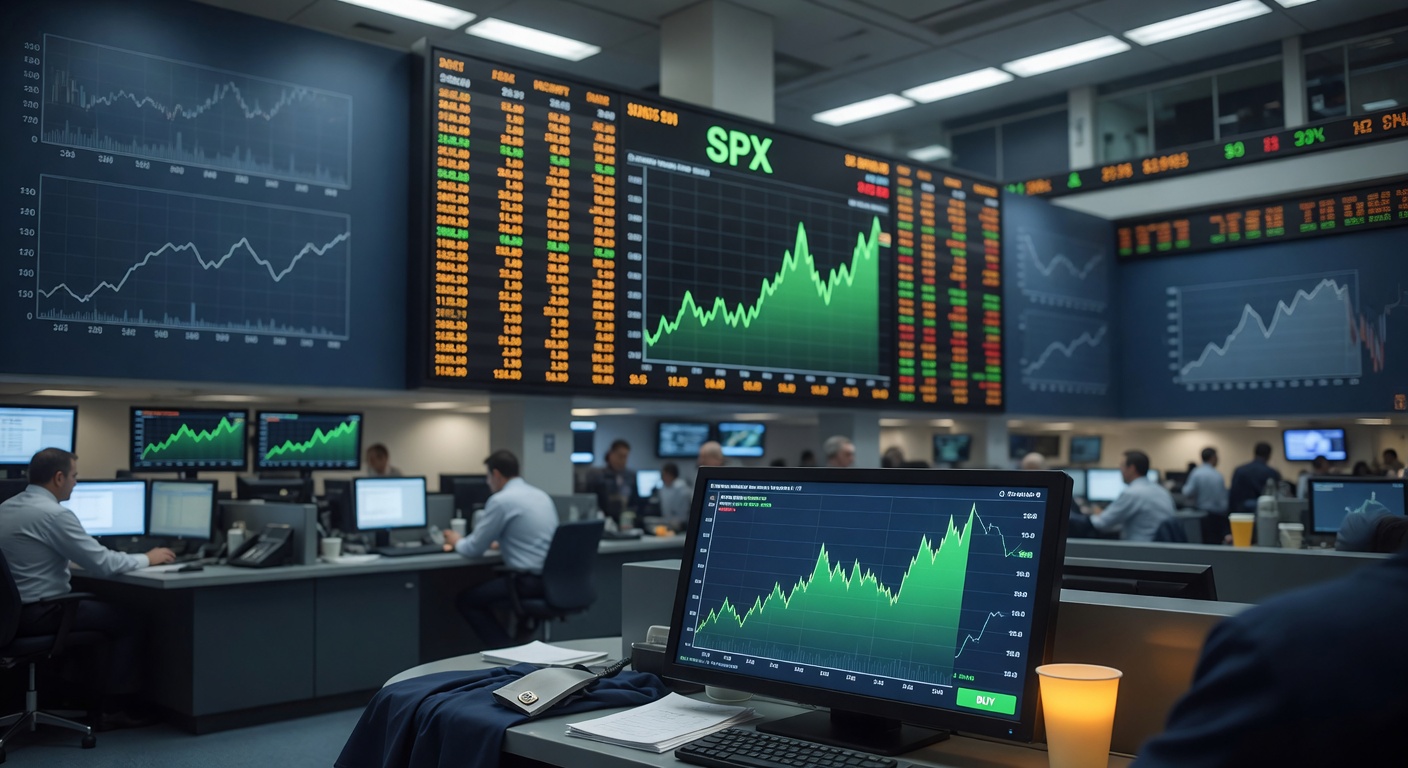
Dow Jones Hits New Record Close, S&P 500 Posts Eighth Winning Week
On May 22, 2026, the Dow Jones Industrial Average gained 294.04 points (0.58%) to close at a record 50,579.70, while the S&P 500 rose 0.37% to 7,473.47 and the Nasdaq gained 0.19% to 26,343.97. The S&P marked its eighth straight weekly gain amid easing yields and market optimism.
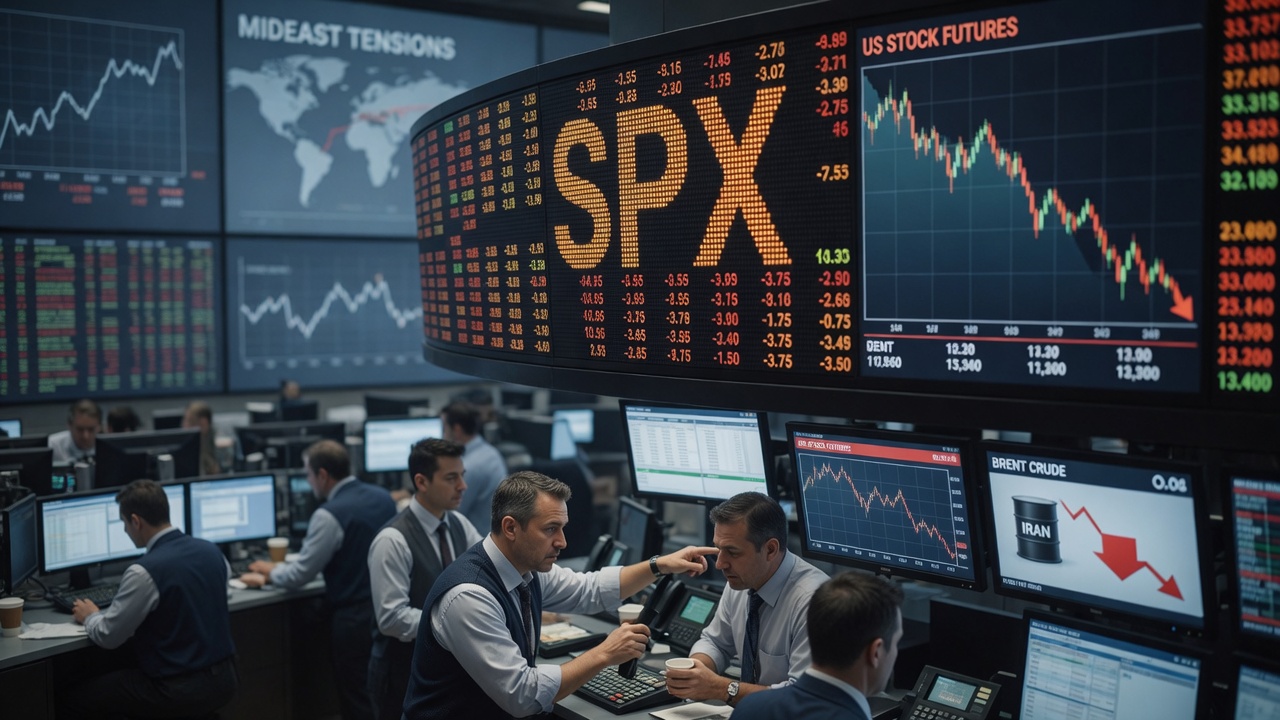
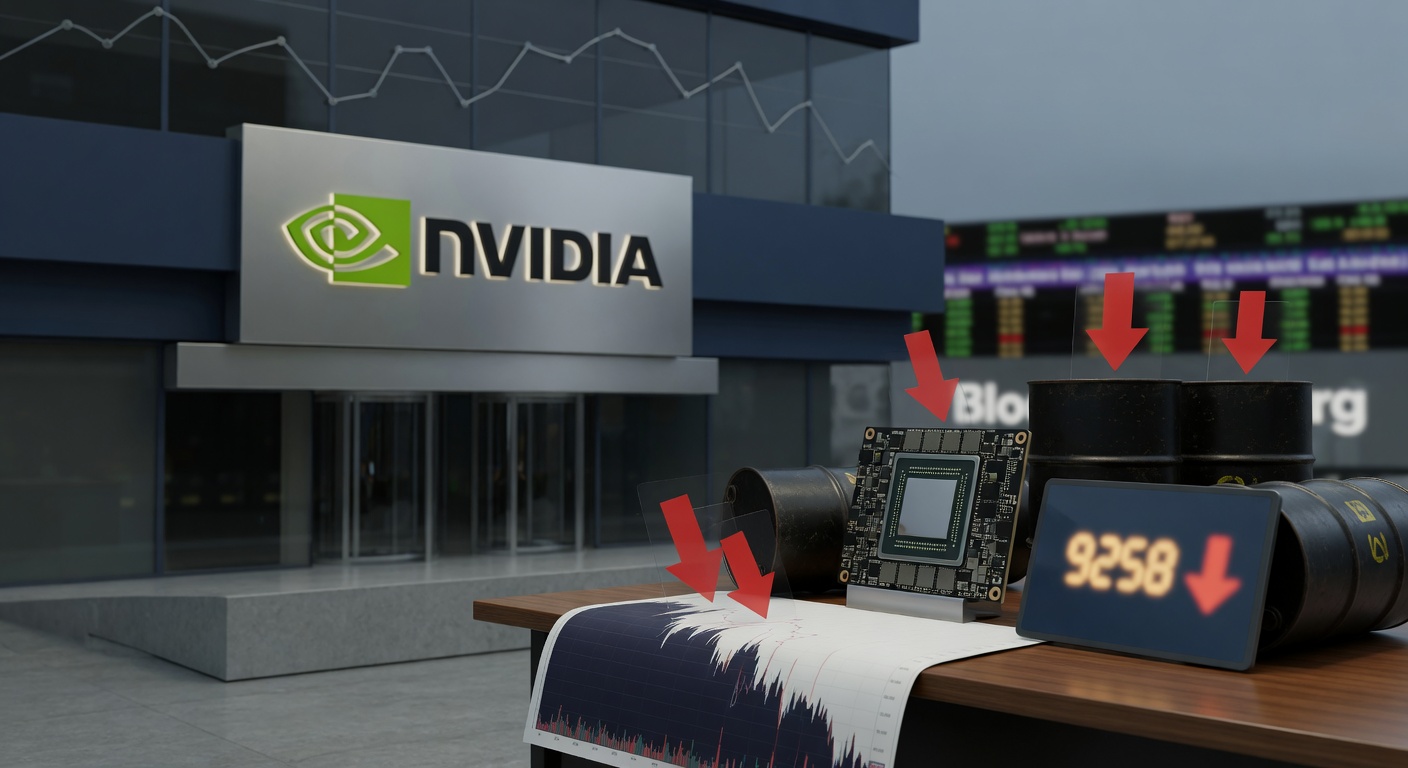
S&P 500 and Nasdaq Fall as Oil Prices Pop and Nvidia Weighs on Tech
Major U.S. indices declined on Thursday with the S&P 500 down about 0.5% and Nasdaq losing 0.7%, pressured by rising crude prices, higher Treasury yields, and Nvidia's post-earnings selloff. The Dow traded near flat amid broader market caution.
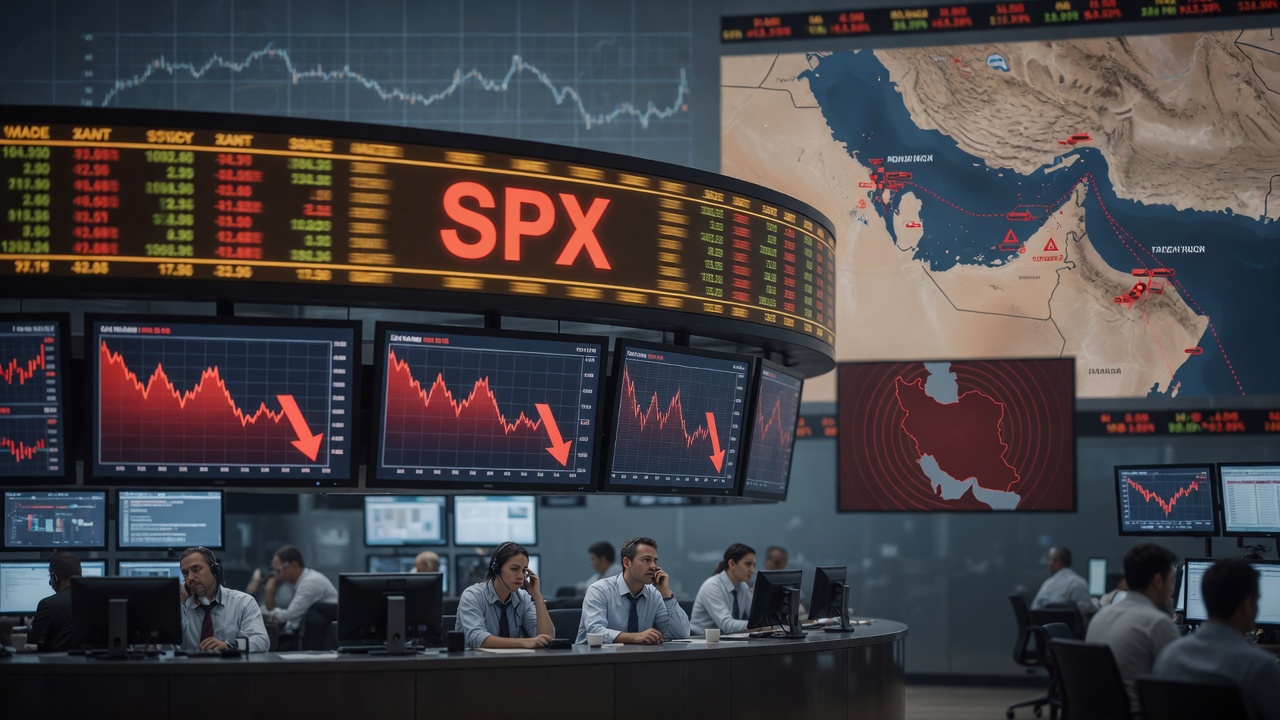
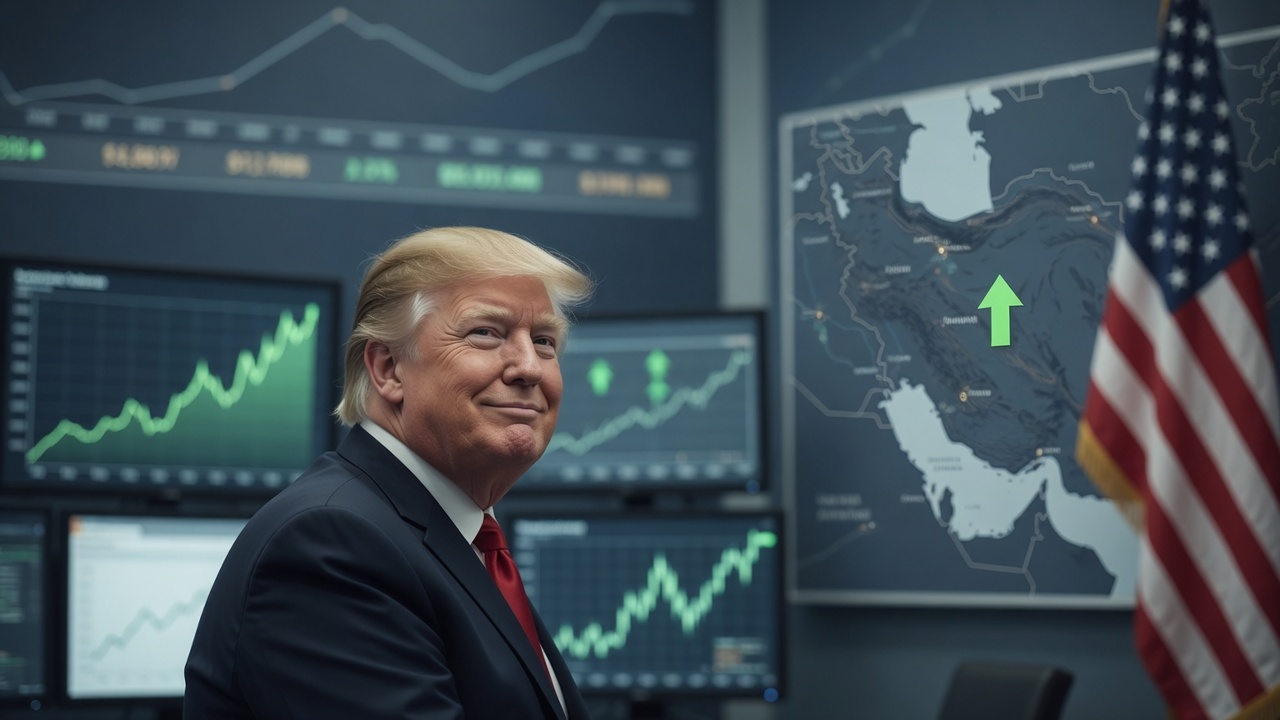
Major U.S. Indices Surge on Iran De-escalation Hopes
On June 11, 2026, the Dow Jones rose 929.97 points (1.86%) to 50,848.75, S&P 500 gained 1.75% to 7,394.30, and Nasdaq jumped 2.54% to 25,809.66 after President Trump announced cancellation of planned strikes on Iran and progress toward a deal.
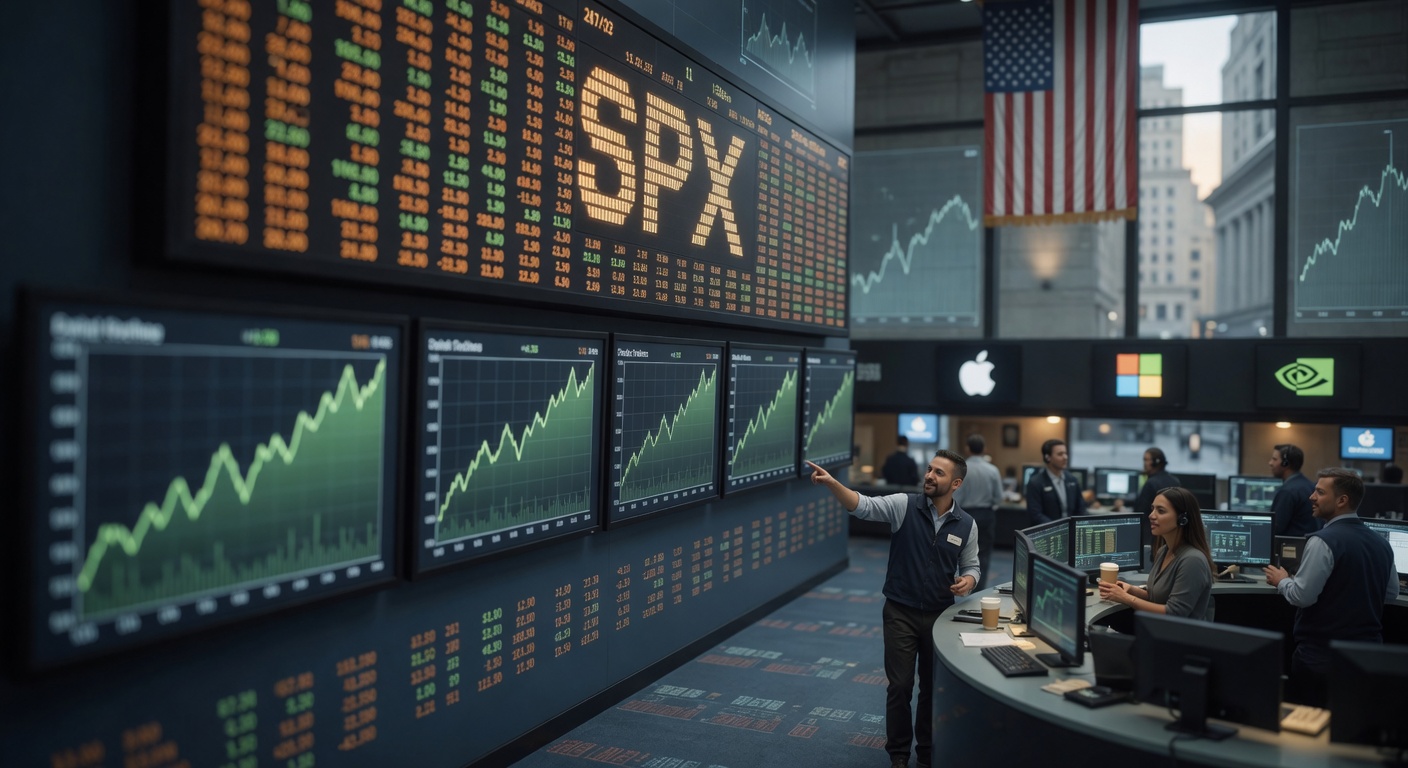
US Major Indices Close at Record Highs on May 29
The Dow Jones Industrial Average rose 0.72% to a record 51,032.46, the S&P 500 gained 0.22% to 7,580.06, and the Nasdaq Composite added 0.2% to 26,972.62, all finishing at all-time highs with tech leading amid Iran deal optimism.
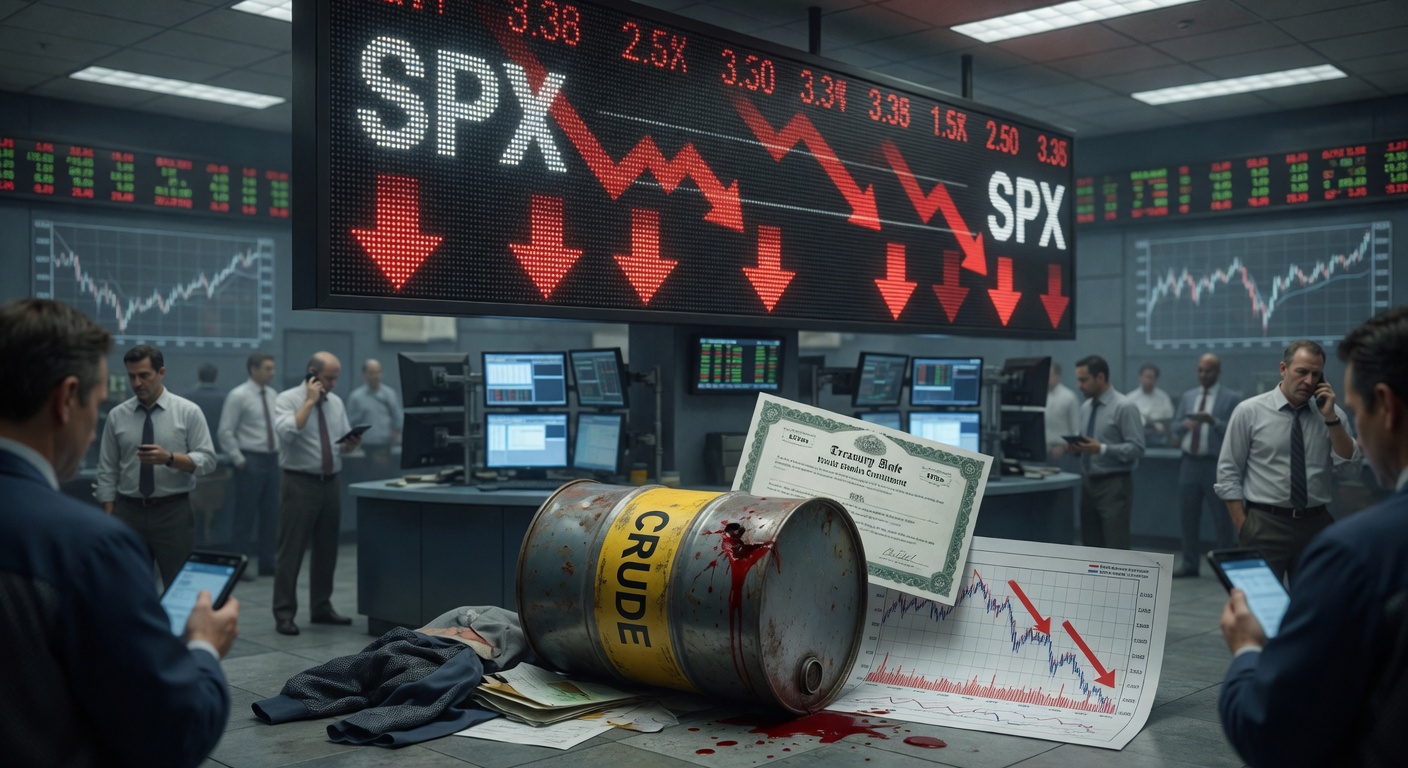
Major US Indices Decline Sharply on June 3, 2026
The Dow Jones Industrial Average dropped 620.72 points (1.21%) to 50,687.07, the S&P 500 fell 0.74% to 7,553.68, and the Nasdaq Composite declined 0.89% to 26,853.98, snapping a nine-day winning streak. The sell-off was driven by rising oil prices and Treasury yields amid escalating US-Iran tensions in the Middle East.
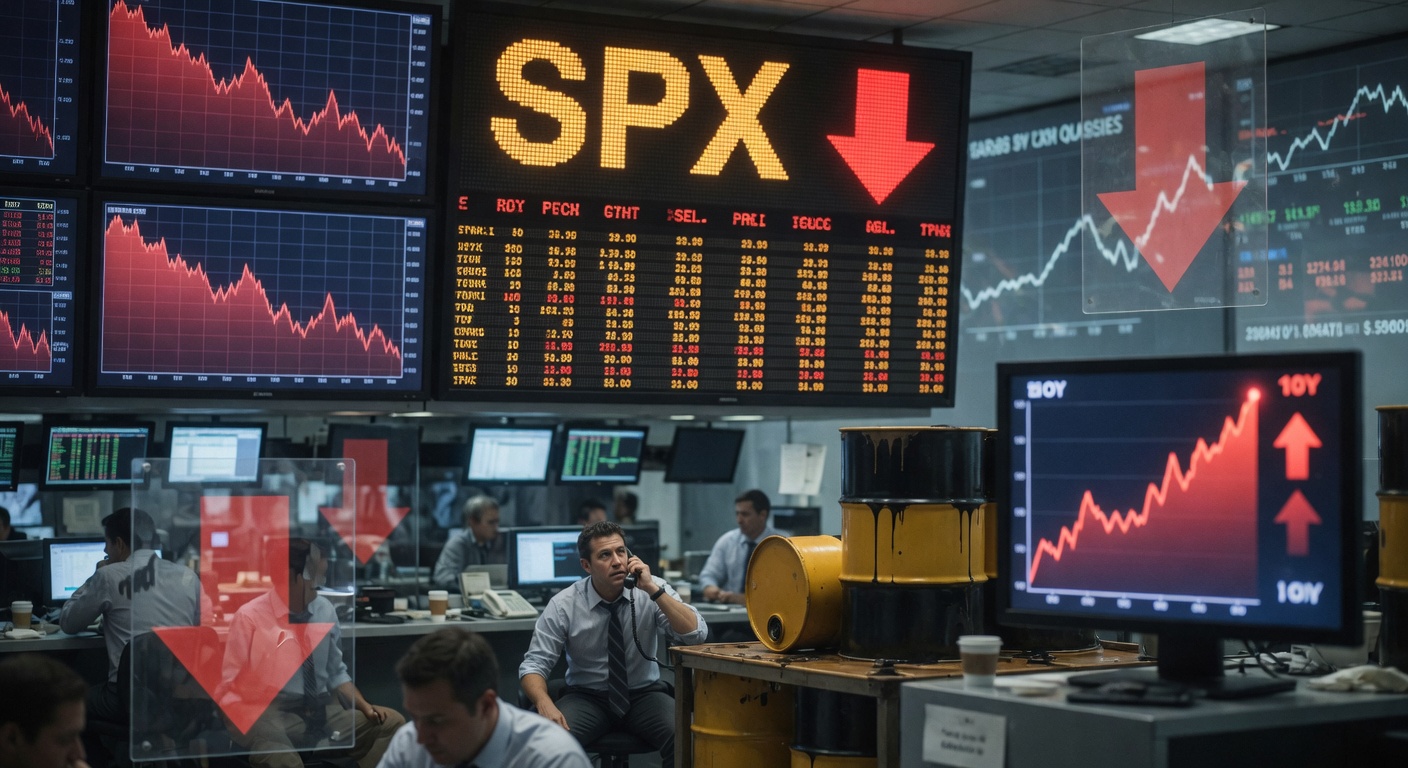
U.S. Major Indices Drop Sharply on June 3 Amid Geopolitical Tensions
The Dow Jones Industrial Average fell 620.72 points (1.21%) to 50,687.07, the S&P 500 declined 0.74% to 7,553.68, and the Nasdaq Composite dropped 0.89% to 26,853.98, snapping the S&P's nine-day winning streak as oil prices and Treasury yields rose due to U.S.-Iran conflict concerns.
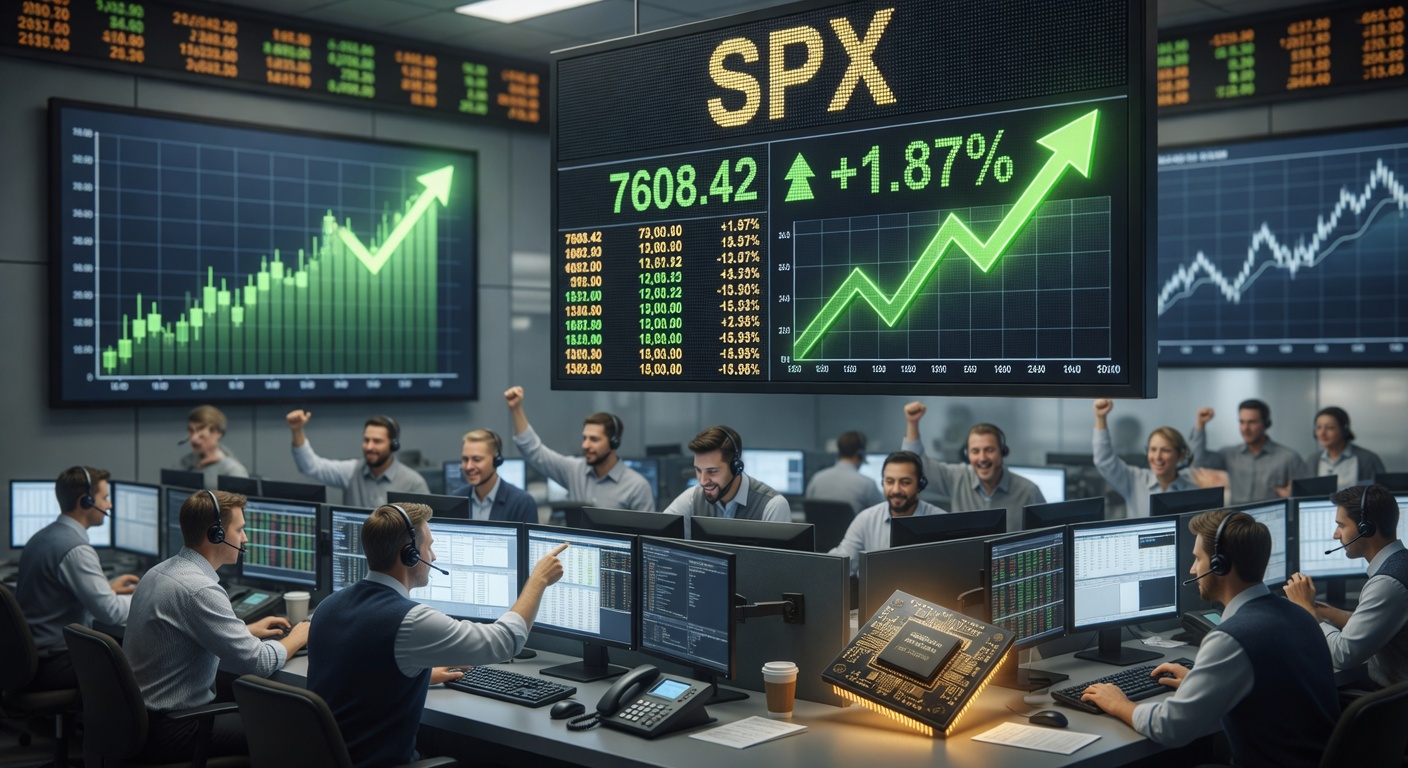

S&P 500, Dow and Nasdaq Close at Fresh Record Highs
On June 2, 2026, the S&P 500 rose 0.13% to close at 7,609.78 for its first close above 7,600, the Dow gained 228.91 points or 0.45% to 51,307.79, and the Nasdaq edged up 0.03% to 27,093.90, marking the fifth straight session of record closes amid AI enthusiasm.
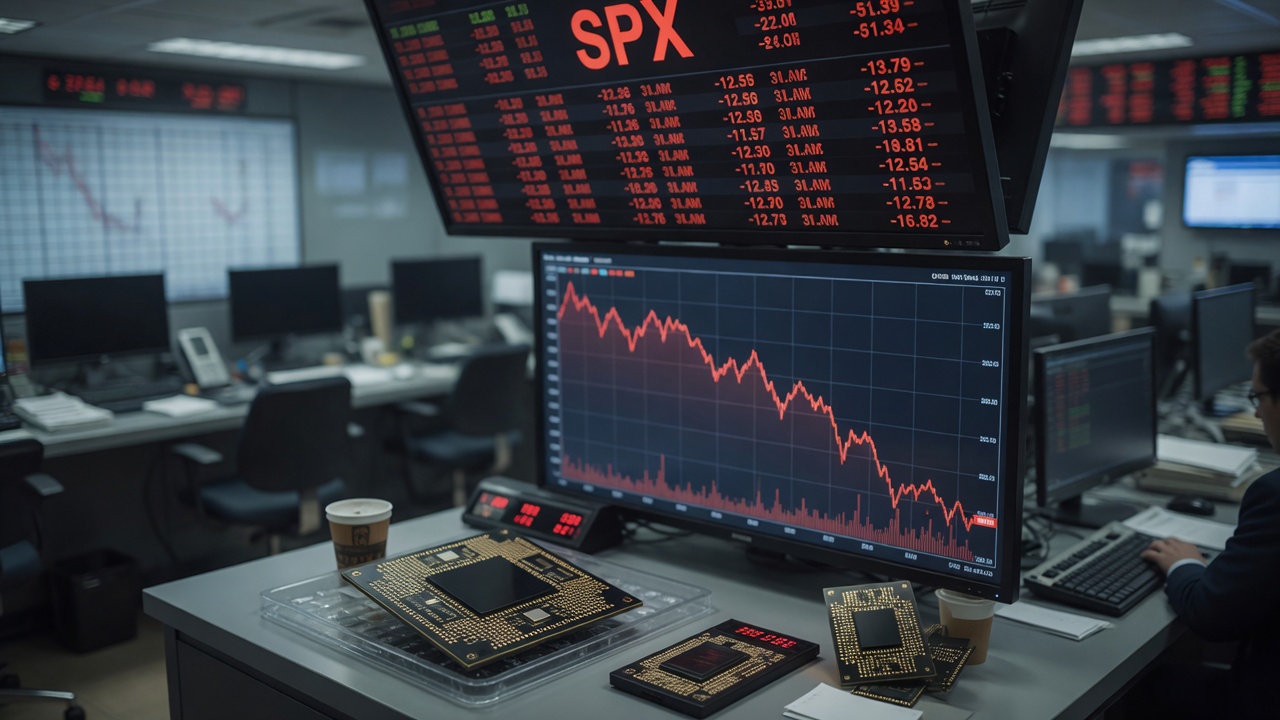
S&P 500 and Nasdaq Decline on June 9 as Chip Stock Selloff Resumes
The S&P 500 fell 0.26% to close at 7,386.65 and the Nasdaq Composite dropped 0.97% to 25,678.82 on Tuesday, June 9, as a chip stock rebound lost momentum. The Dow Jones Industrial Average rose 0.17% to 50,872.11.
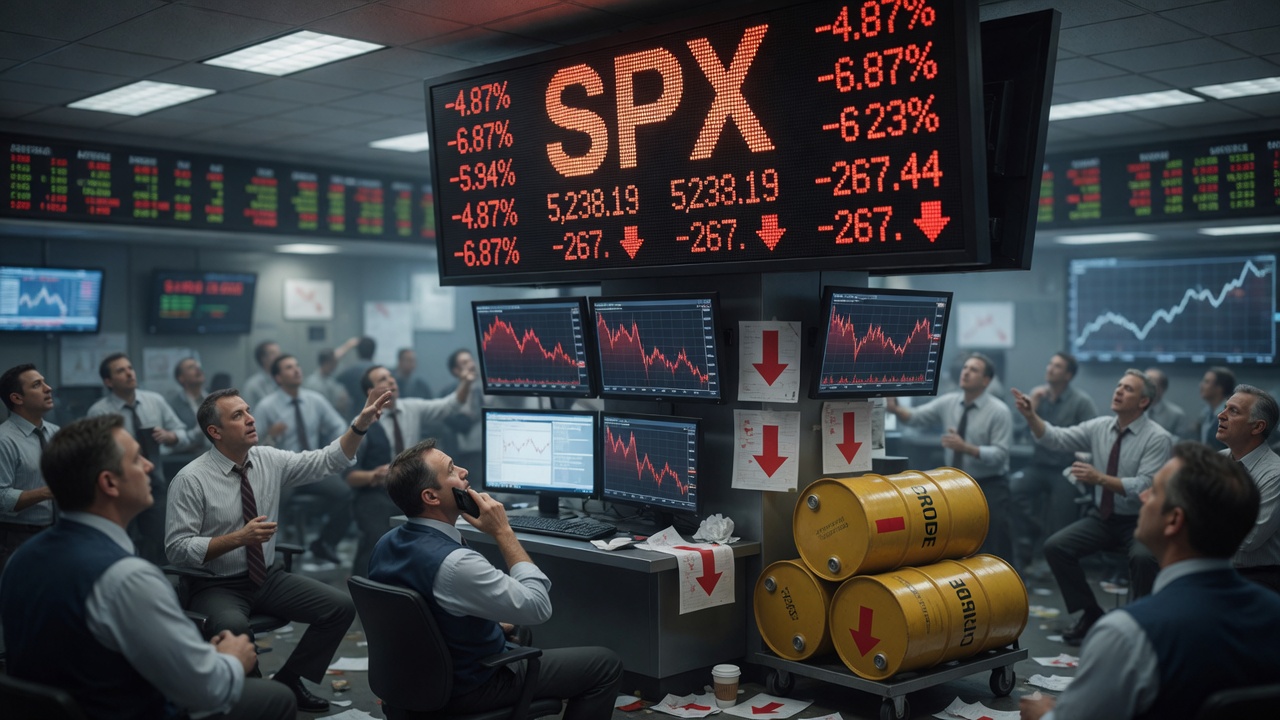
Major US Indices Fall Sharply Amid Iran Conflict Escalation
On June 10, 2026, the Dow Jones Industrial Average dropped 1.87% to 49,918.78, the Nasdaq Composite fell 1.98%, and the S&P 500 declined 1.62%, as U.S. strikes against Iran pushed oil prices higher and weighed on investor sentiment.
US Major Indices Close at or Near Records Amid Geopolitical Optimism
The Dow Jones Industrial Average rose 294 points or 0.58% to 50,579.70, S&P 500 gained 0.37% to 7,473.47, and Nasdaq added 0.19% to 26,343.97 in recent trading, with the Dow hitting intraday and closing records.
Understand the moves behind the headlines
A stop-loss is a pre-set exit that caps the loss on a trade. Learn where to place it, why percentage-based stops fail, and how it links to position size.
The risk/reward ratio compares what you stand to lose against what you stand to gain. Learn how it pairs with win rate to determine profitability.
Each candlestick shows the open, high, low and close for one period. Learn how to read the body, the wicks, and the patterns that actually matter.