Nasdaq News & Market Digest
Nasdaq-100 news and the tech giants moving the index.

Nasdaq Suffers Worst Day Since April 2025, Drops 4.18%
The tech-heavy Nasdaq Composite plunged 4.18% to close at 25,709.43 on June 5, 2026, its largest single-day decline in over a year, amid a broad selloff in chip stocks. The drop followed a hotter-than-expected May jobs report that fueled fears of higher interest rates.

Tech Selloff Deepens on AI Spending Jitters
Nasdaq Composite tumbled more than 2% with Alphabet, Nvidia, Oracle, and Tesla sharply lower as futures on Nasdaq 100 fell over 2.5%. Concerns over heavy AI capital expenditures and looming Fed rate increases are pressuring sentiment following recent losses.


US Major Indices Plunge on June 5 Selloff
The Nasdaq Composite fell 4.18% to 25,709.43, its worst day since April 2025, while the S&P 500 dropped 2.64% to 7,383.74 and the Dow Jones Industrial Average declined 1.35% to 50,866.78, driven by a broad rotation out of tech and AI-linked stocks.



Nasdaq Slides After Fed Hints at Higher Rates
On June 17, 2026, the Dow Jones fell 507 points (0.98%) to 51,492.55, S&P 500 dropped 1.21% to 7,420.10, and Nasdaq Composite fell 1.34% to 26,021.66 after the Federal Reserve held rates steady but projected a possible rate hike later this year due to inflation concerns.



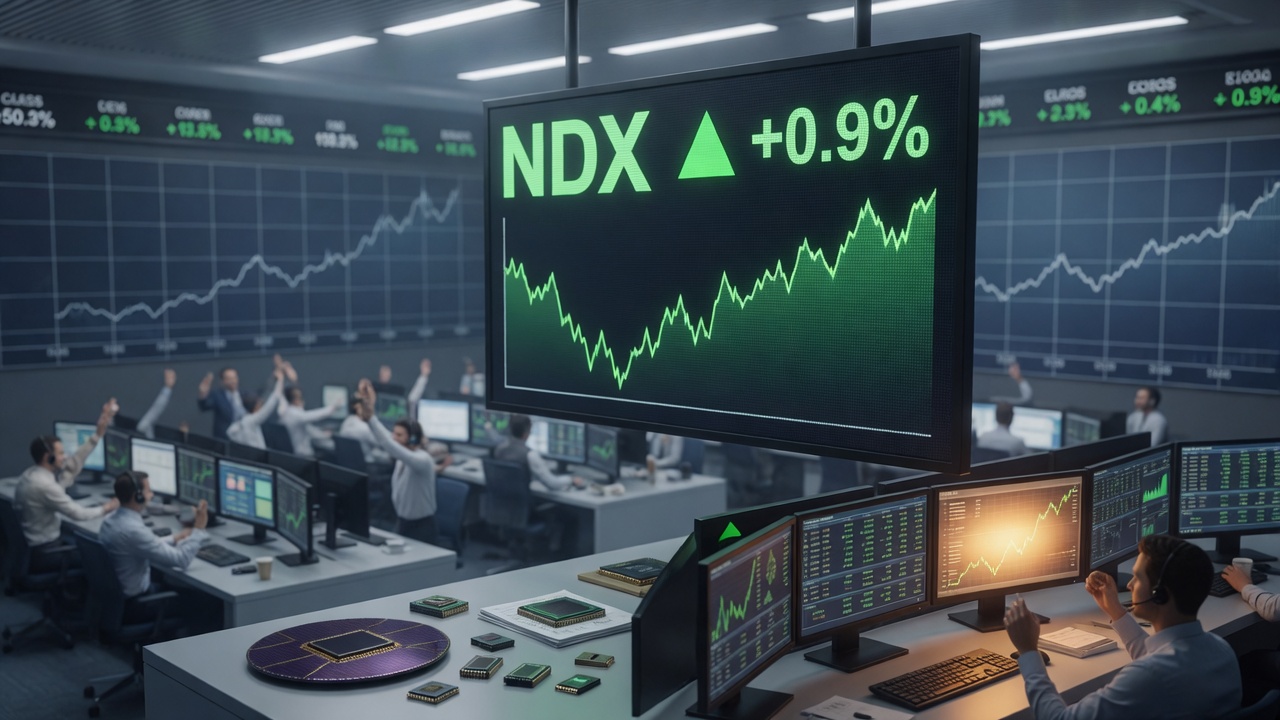
Nasdaq rebounds 0.9% on June 8 after Friday selloff
The tech-heavy Nasdaq Composite closed up 0.9% on June 8, 2026, while the S&P 500 rose 0.3%; the Dow slipped 0.2%. AI-related chip stocks led the recovery following the prior week's sharp decline triggered by hot May jobs data.

Nasdaq Composite falls 1.32% as tech stocks slide
The Nasdaq Composite declined 1.32% to close at 26,166.60 on June 22, 2026, dragged by losses in major tech names including Alphabet (-5%), Amazon (-4.8%), and Meta (-2.3%). SpaceX shares plunged 16% for a third straight day, weighing on the index as it comprises about 5% of the Nasdaq.


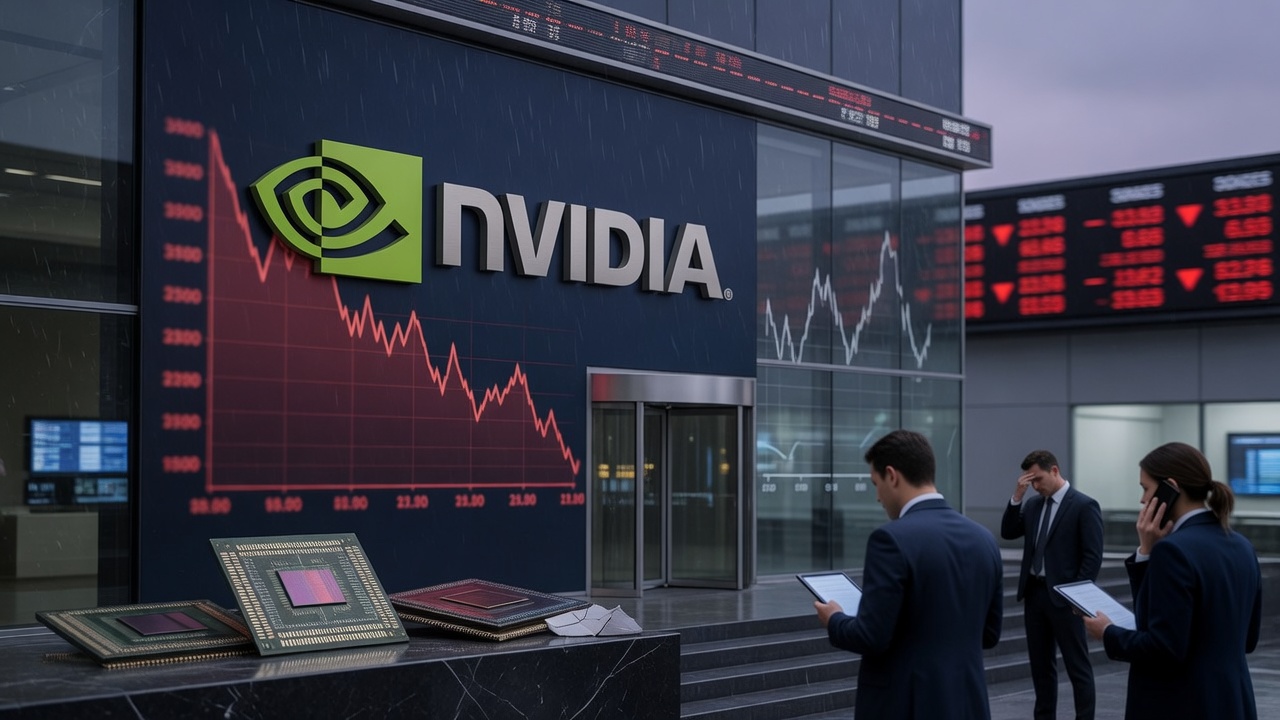
Nasdaq Slides as Semiconductor Stocks Sell Off
Tech-heavy Nasdaq dropped 0.8% to 25,832.67 on July 2 as chipmakers including Nvidia (-1.4%), Micron (-5.5%), and others tumbled for a second day, with profit-taking after strong first-half gains. Semiconductor ETF SMH fell 4.5%.
Understand the moves behind the headlines
A stop-loss is a pre-set exit that caps the loss on a trade. Learn where to place it, why percentage-based stops fail, and how it links to position size.
The risk/reward ratio compares what you stand to lose against what you stand to gain. Learn how it pairs with win rate to determine profitability.
Each candlestick shows the open, high, low and close for one period. Learn how to read the body, the wicks, and the patterns that actually matter.